Introduction
Between 1996 and 2020, the world lost a net 6,900 km² of mangrove forest - roughly 4.5% of the global total. Over the same period, the share of mangroves under formal protection almost doubled, from 19% to 38%. The two trends move in opposite directions, something I’ve wanted to understand for some time.
I started looking at this in 2019, for my MSc thesis, which investigated how much mangrove deforestation Indonesia’s protected areas actually prevented. That study used matched sampling, a statistical technique that controls for the fact that protected areas tend to sit in remote regions that would have faced lower levels of deforestation anyway. Between 2000 and 2017, it found that Indonesian protected areas prevented only about 3.5% of the loss they would otherwise have faced.
The dashboard below is a broad global overview of mangrove extent inside and outside protected areas between 1996 and 2020. I plan to redo the thesis methodology at a global scale and extend this dashboard with the results - which will allow us to directly measure protected area and country level performance at preventing mangrove deforestation.
How to use this dashboard
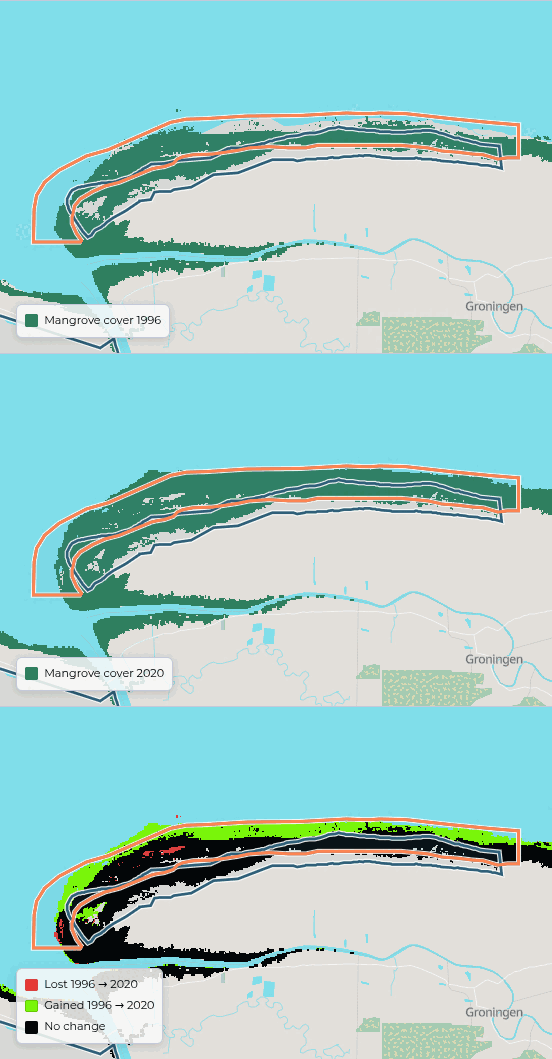
You can use the Dashboard controls window on the right of this pageat the bottom of the screen to toggle various aspects of the dashboard, such as compare between different years, filter the table, or change the view of the map. Some charts show a different view (extent vs changes), and can be toggled using the switch above them. And the map shows both plain mangrove extent (coloured in green), and a change view - which shows forest loss (in red), gain (green) and no change (black) between the selected years.
Skip to the country table and map ↓Global summary
By 2020, almost 2,500 protected areas contained mangroves. Between 1996 and 2020, roughly 12,000 km² of mangrove forest was lost while about 5,100 km² of new cover appeared.
Nearly 90% of the net loss happened before 2010, and since 2015 global extent has been essentially flat. The rise in the protected share is not an artifact of a shrinking total: mangrove area under formal protection roughly doubled in absolute terms, from about 29,700 km² in 1996 to 55,800 km² in 2020.
Change by protection strictness
Not all protection is equal. IUCN assigns each protected area a management category, and the cards below group them into strict reserves (Ia–II), reserves that allow more human use (III–VI), and areas with no category reported. Unprotected mangroves sit alongside for comparison.
Between 1996 and 2020, unprotected mangroves lost cover at 0.36% per year against 0.25% inside strict reserves. This indicates lower rates of forest loss inside of protected areas. However, this should be interpreted with caution, as policy makers tend to designate PAs in remote places that would have faced less pressure anyway. So it’s not possible to equate lower loss rates with PA effectiveness (which was the central theme of my thesis).
Country comparison
Mangrove loss is concentrated: Indonesia, home to a fifth of the world’s mangroves, accounts for a quarter of all gross loss since 1996, and five countries - Indonesia, Australia, Mexico, Brazil and Myanmar - account for half of it.
The picture inside protected areas is different. Indonesia accounts for only about 1% of the global loss that occurred inside PAs, because most of its loss fell on unprotected forest (and Indonesia protects just 8% of its mangroves). The largest shares of protected-area loss are in Mexico (17%) and Brazil (16%).
Protection rates also vary enormously. Bangladesh has 89% of its mangroves inside protected areas and has slightly grown its total cover since 1996. Pakistan protects 36% but has lost more than a fifth of its mangrove area over the same period. Keti Bunder South, one of its protected areas, lost 56% of its mangroves and accounts for about a quarter of the national decline. Brazil grew its protected share from 49% to 85% while losing less than 1% of cover. Suriname, with 52% protection, actually gained 6% more forest, with Coppename Monding gaining 56% more mangrove cover since 1996. Click the links, or jump to the table and map below to explore further.
Skip to the country table and map ↓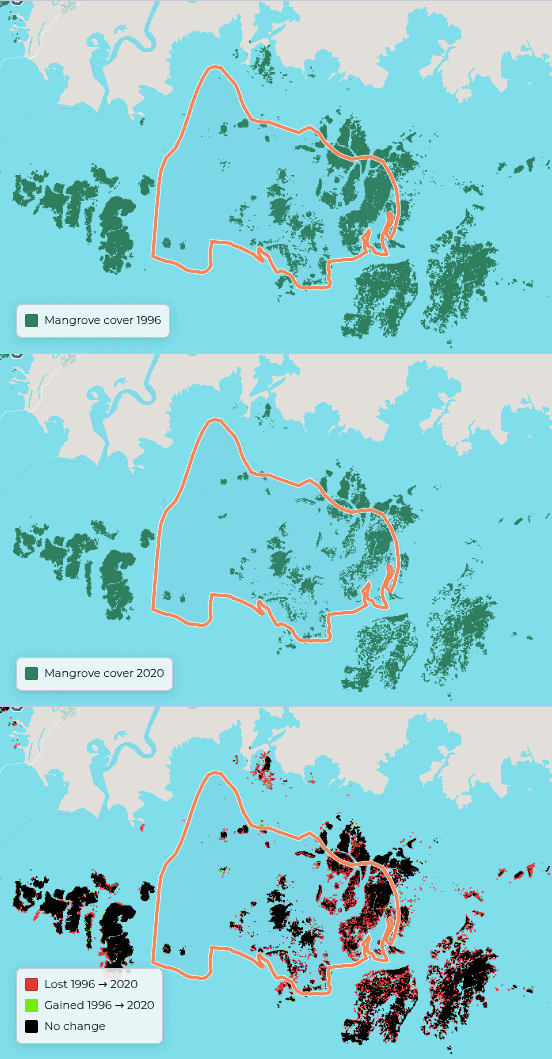
Globally, 38% of mangrove cover is protected, which is already above the 30% target³. However, 37 of the 107 countries with mangroves remain below it.
What this shows
Three findings stand out. First, mangrove loss has slowed considerably: nearly 90% of the net decline happened before 2010, and global extent has been roughly stable since 2015. Second, protection expanded substantially over the same period, from 19% to 38% of global cover. Third, the difference in loss rates between protected and unprotected mangroves is modest: unprotected mangroves lost cover about 1.3 times faster, and a third of all loss occurred inside protected area boundaries.
Whether protection caused the slowdown is a question this dashboard cannot answer, because protected areas are not designated at random. In Indonesia, my thesis found they prevented only about 3.5% of the loss they would otherwise have faced. The next step is to apply that matched-sampling method globally, measuring prevented loss directly for every country and protected area, and to extend this dashboard with the results.
¹ A protected area counts toward year Y only if its WDPA ² Designation trend compares an area’s annualised rate of change before and after its designation year. Reads “n/a” without a designation year, or with fewer than two surveys either side. ³ 30% target is Target 3 of the Kunming-Montreal Global Biodiversity Framework: 30% of land and sea protected by 2030. It is drawn against mangrove extent for reference only — the target is not mangrove-specific. The “Changes” views show cover lost (red) and gained (green) between the baseline year and the selected year; black is unchanged. Loss and gain are gross, so a pixel lost and regained nets out. The 1996 baseline is JERS-1 radar and noisier than later years, so some apparent change against it is classification artifact.status_yr is known and ≤ Y.
Data sources
Protected areas: IUCN and UNEP-WCMC (2020), The World Database on Protected Areas (WDPA) and World Database on Other Effective Area-based Conservation Measures (WD-OECM), December 2020 release, downloaded 2026-09-02. Cambridge, UK: UNEP-WCMC and IUCN. This release is used, rather than a current one, to read the network as it stood at the end of the period covered. Available at protectedplanet.net under the UNEP-WCMC data licence. Boundaries shown are simplified for display; obtain the data itself from Protected Planet. Mangrove extent: Bunting P., Rosenqvist A., Hilarides L., Lucas R.M., Thomas N., Tadono T., Worthington T.A., Spalding M., Murray N.J., Rebelo L-M. (2022). Global Mangrove Watch (1996–2020) Version 3.0 Dataset. Remote Sensing 14(15):3657, doi:10.3390/rs14153657. Licensed CC BY 4.0. Basemap: © OpenStreetMap contributors (ODbL), rendered with Protomaps. Country boundaries derived from OpenStreetMap.